Technical Analysis - The Slow Stochastic Oscillator

My go-to technical analysis tool is without a doubt, the Slow Stochastic indicator. The Slow Stochastic Oscillator is a form of momentum analysis used in the technical analysis of securities. Its range is between 0 and 100. Since it is a range-bound indicator, it traditionally shows overbought and oversold signals. Developed by Dr. George Lane, a securities trader and technical analyst, it applies support and resistance levels to forecast turning points in the price of a security by comparing its closing price to its price range over a specific period of time, typically 14 days. Adjusting the period of time on the Slow Stochastic indicator will change the sensitivity of the charts results. This difference in sensitivity gives rise to the two most popular types of Stochastic charting: Fast and Slow Stochastic Oscillators.
The Slow Stochastic indicator helps to identify how daily closing prices tend to accumulate near the lows of the range during periods of fall in price. Conversely, it also determines how daily closing prices tend to lay near the highs of the range in periods of increase in price. It does so by highlighting the position of the closing price over a high-low range during the specific time. Although less sensitive to changes in price than the Fast Stochastic Oscillator; the Slow Stochastic Oscillator processes more input before it generates a signal. Its chances of producing a false signal are thereby reduced.
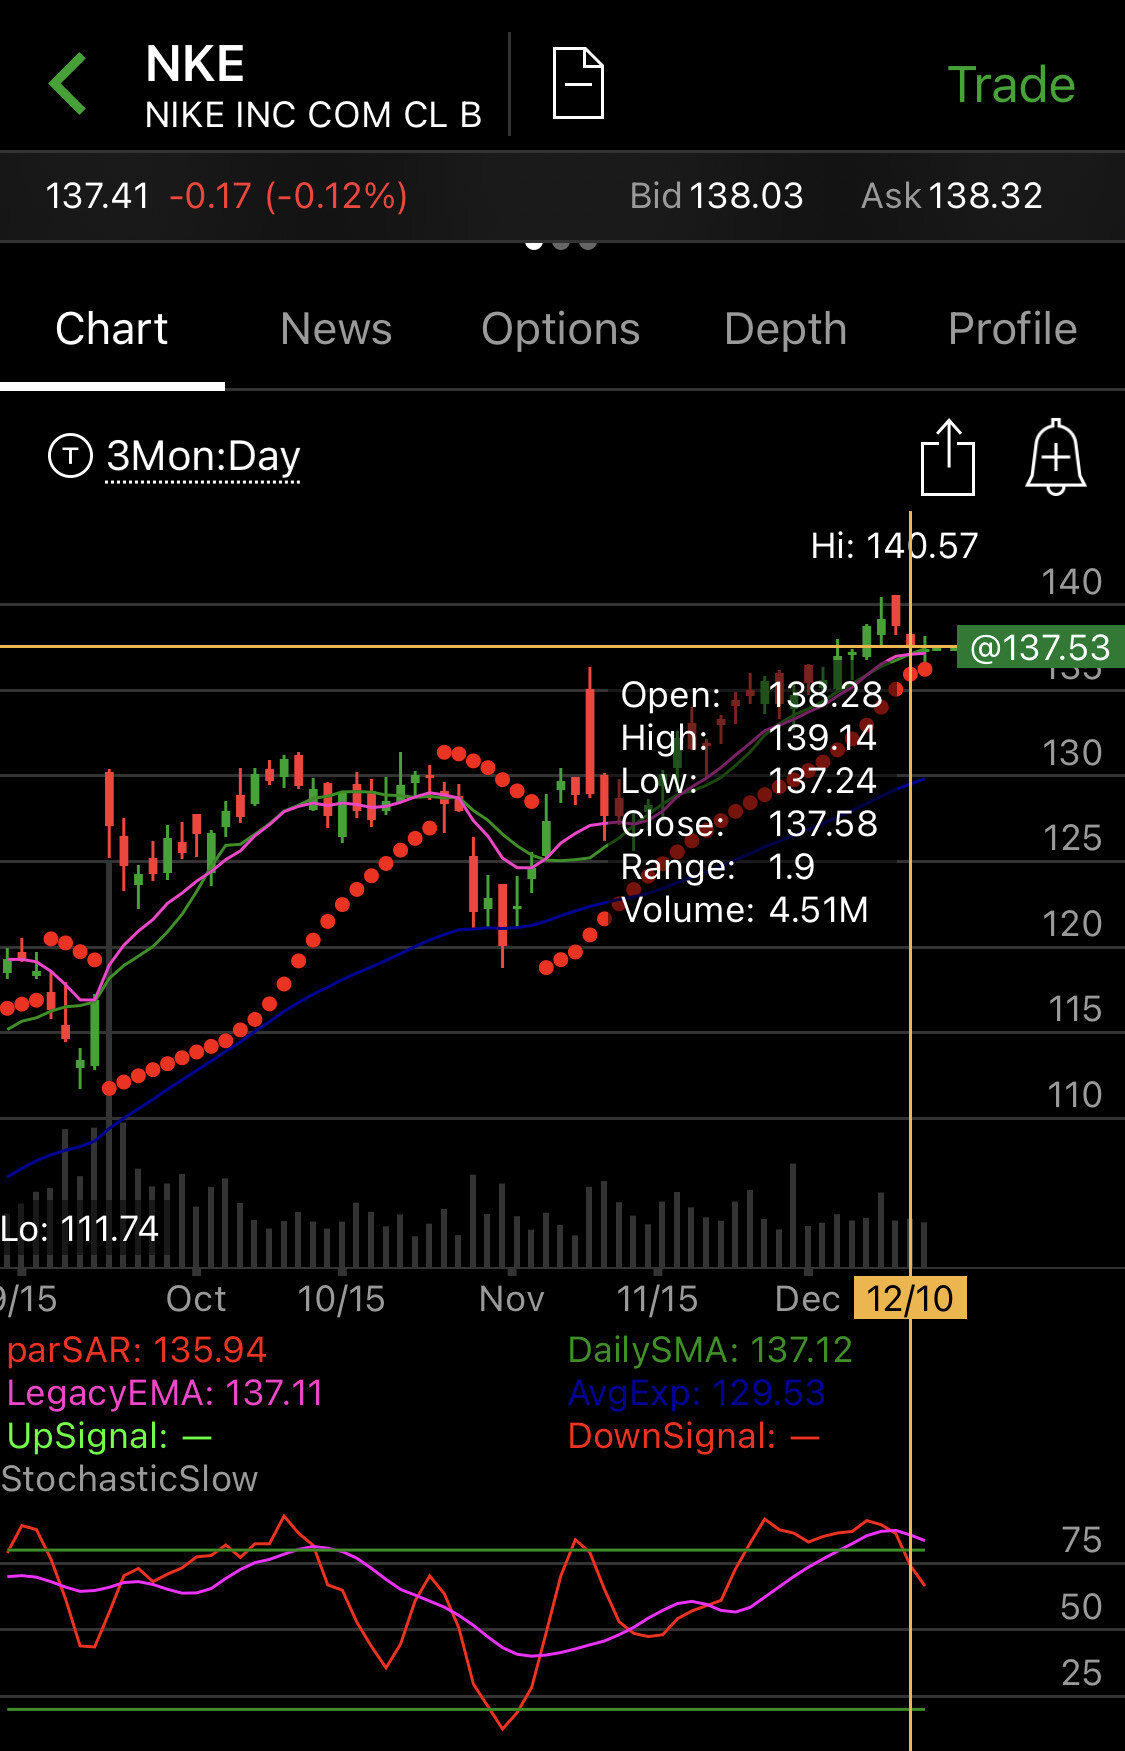
So, how does the Slow Stochastic indicator work? The area above 80 is generally considered the overbought region while that below 20 is regarded as the oversold region. Hence, the indicator signals a sell when it is above 80 and then crosses back below it. This particular example can be seen in the screenshot below. The top of the chart is the daily stock price of Nike stock (NKE) for the past 3 months, while the bottom of the screenshot is the Slow Stochastic indicator. As the example shows, Nike stock (NKE) can be seen crossing below the 80 line on December 10th, 2020, signaling a sell (Lets watch this over the next few days and see how this plays out). Personally, I use a 3 month chart when swing trading. Feel free to adjust the charts timeframe for your preferred trading strategy. Also note, a buy signal is given when it is below 20 and then crosses above it. In this instance, 80 and 20 serve like the support and resistance respectively.
The Slow Stochastic Oscillator also uses two lines for triggering its signals: the %K line and the %D line. Signals are produced when they cross each other in either the overbought or the oversold region. In the overbought region, a sell signal is triggered when a decreasing %K line goes below the %D line. It is when an increasing %K line crosses above the %D line that a buy signal is generated in the oversold region. However, divergences, which are alerts of potential trend reversals, are formed when the Stochastic does not move in-line with price. When for instance the price makes a lower low, but the Slow Stochastic makes a higher low, a bullish divergence is formed. On the other hand, a bearish divergence occurs when the Slow Stochastic forms a lower high as the price makes a higher high.
The Slow Stochastic Oscillator can be calculated using the formula:
Slow %K = 100[sum of the (C - L14) for the %K Slowing Period / Sum of the (H14 - L14) for the %K Slowing Period]
Slow %D = SMA (Simple Moving Average) of Slow %K
In the formula, C is the most recent closing price, L14 is the lowest low for the past 14 periods, and H14 is the highest high for the same periods.
Happy Trading,